
Note
Go to the end to download the full example code.
Network Response#
In this tutorial we will cover how to do statistical significance testing for a ‘network response’. This is the average state/mode time course epoched around events of interest. We test is the response is significantly different from zero.
Get network response#
First we need to get the network response for each subject. This is the epoched state/mode time course averaged over trials, which would be a (subjects, states/modes, time) array. In this tutorial, we will simulate this.
import numpy as np
n_subjects = 20
n_time = 250
n_networks = 6
network_response = np.random.normal(size=(n_subjects, n_time, n_networks))
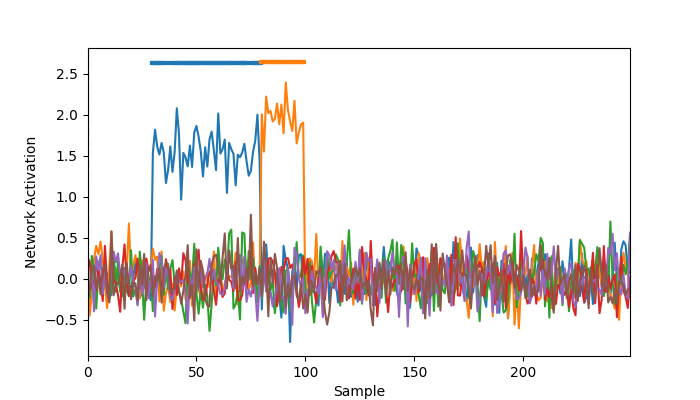
# Add non-zero network response for the first network for time points 30-80
network_response[:, 30:80, 0] += 1.5
# Add non-zero network response for the second network for time points 80-100
network_response[:, 80:100, 1] += 2
Statistical significance testing#
osl-dynamics has the analysis.statistics.evoked_response_max_stat_perm function for doing GLM permutation stats testing see if a value is significantly different from zero. This function uses the maximum test statistic to control for multiple comparisons across the time points and networks.
from osl_dynamics.analysis import statistics

pvalues = statistics.evoked_response_max_stat_perm(
    network_response,
    n_perm=1000,
    n_jobs=4,
)
print(pvalues.shape)
QUEUEING TASKS | Running permutations:   0%|          | 0/1000 [00:00<?, ?it/s]
QUEUEING TASKS | Running permutations:  59%|█████▊    | 586/1000 [00:00<00:00, 5857.03it/s]
QUEUEING TASKS | Running permutations: 100%|██████████| 1000/1000 [00:00<00:00, 8881.53it/s]

PROCESSING TASKS | Running permutations:   0%|          | 0/1000 [00:00<?, ?it/s]
PROCESSING TASKS | Running permutations:   2%|▏         | 19/1000 [00:00<00:05, 187.07it/s]
PROCESSING TASKS | Running permutations:   5%|▍         | 49/1000 [00:00<00:03, 245.90it/s]
PROCESSING TASKS | Running permutations:   8%|▊         | 79/1000 [00:00<00:03, 267.73it/s]
PROCESSING TASKS | Running permutations:  11%|█         | 106/1000 [00:00<00:03, 264.14it/s]
PROCESSING TASKS | Running permutations:  14%|█▎        | 136/1000 [00:00<00:03, 275.07it/s]
PROCESSING TASKS | Running permutations:  17%|█▋        | 168/1000 [00:00<00:02, 287.04it/s]
PROCESSING TASKS | Running permutations:  20%|██        | 202/1000 [00:00<00:02, 292.68it/s]
PROCESSING TASKS | Running permutations:  23%|██▎       | 234/1000 [00:00<00:02, 295.62it/s]
PROCESSING TASKS | Running permutations:  27%|██▋       | 267/1000 [00:00<00:02, 304.34it/s]
PROCESSING TASKS | Running permutations:  30%|███       | 301/1000 [00:01<00:02, 305.85it/s]
PROCESSING TASKS | Running permutations:  33%|███▎      | 333/1000 [00:01<00:02, 303.71it/s]
PROCESSING TASKS | Running permutations:  36%|███▋      | 364/1000 [00:01<00:02, 298.65it/s]
PROCESSING TASKS | Running permutations:  40%|███▉      | 396/1000 [00:01<00:02, 300.48it/s]
PROCESSING TASKS | Running permutations:  43%|████▎     | 427/1000 [00:01<00:01, 301.48it/s]
PROCESSING TASKS | Running permutations:  46%|████▌     | 461/1000 [00:01<00:01, 309.28it/s]
PROCESSING TASKS | Running permutations:  49%|████▉     | 492/1000 [00:01<00:01, 306.43it/s]
PROCESSING TASKS | Running permutations:  52%|█████▏    | 523/1000 [00:01<00:01, 305.81it/s]
PROCESSING TASKS | Running permutations:  55%|█████▌    | 554/1000 [00:01<00:01, 306.02it/s]
PROCESSING TASKS | Running permutations:  58%|█████▊    | 585/1000 [00:01<00:01, 304.70it/s]
PROCESSING TASKS | Running permutations:  62%|██████▏   | 619/1000 [00:02<00:01, 306.96it/s]
PROCESSING TASKS | Running permutations:  65%|██████▌   | 650/1000 [00:02<00:01, 298.52it/s]
PROCESSING TASKS | Running permutations:  68%|██████▊   | 682/1000 [00:02<00:01, 304.13it/s]
PROCESSING TASKS | Running permutations:  71%|███████▏  | 713/1000 [00:02<00:00, 295.03it/s]
PROCESSING TASKS | Running permutations:  74%|███████▍  | 743/1000 [00:02<00:00, 293.64it/s]
PROCESSING TASKS | Running permutations:  77%|███████▋  | 773/1000 [00:02<00:00, 291.43it/s]
PROCESSING TASKS | Running permutations:  80%|████████  | 804/1000 [00:02<00:00, 296.38it/s]
PROCESSING TASKS | Running permutations:  83%|████████▎ | 834/1000 [00:02<00:00, 296.89it/s]
PROCESSING TASKS | Running permutations:  86%|████████▋ | 864/1000 [00:02<00:00, 295.28it/s]
PROCESSING TASKS | Running permutations:  89%|████████▉ | 894/1000 [00:03<00:00, 289.80it/s]
PROCESSING TASKS | Running permutations:  92%|█████████▏| 924/1000 [00:03<00:00, 286.30it/s]
PROCESSING TASKS | Running permutations:  96%|█████████▌| 956/1000 [00:03<00:00, 292.98it/s]
PROCESSING TASKS | Running permutations:  99%|█████████▉| 990/1000 [00:03<00:00, 302.98it/s]
PROCESSING TASKS | Running permutations: 100%|██████████| 1000/1000 [00:03<00:00, 295.35it/s]

COLLECTING RESULTS | Running permutations:   0%|          | 0/1000 [00:00<?, ?it/s]
COLLECTING RESULTS | Running permutations: 100%|██████████| 1000/1000 [00:00<00:00, 404738.40it/s]
(250, 6)
Let’s plot the group average network response with the significant time points highlighted.
from osl_dynamics.utils import plotting

t = np.arange(n_time)
group_network_response = np.mean(network_response, axis=0)
fig, ax = plotting.plot_evoked_response(
    t,
    group_network_response,
    pvalues,
    x_label="Sample",
    y_label="Network Activation",
)
Note, this function also has a covariates argument that can be used to account for confounds.
Total running time of the script: (0 minutes 3.746 seconds)